Rules-Based Strategies - The Longest Track Records of Outperformance Ever
Testing investment performance back to October 1928

Hey everyone - it's Som Mohapatra, Chief Investment Officer at Quantbase. Writing a bit today about track records.
What's the longest track record you've ever seen? Maybe Warren Buffett's?
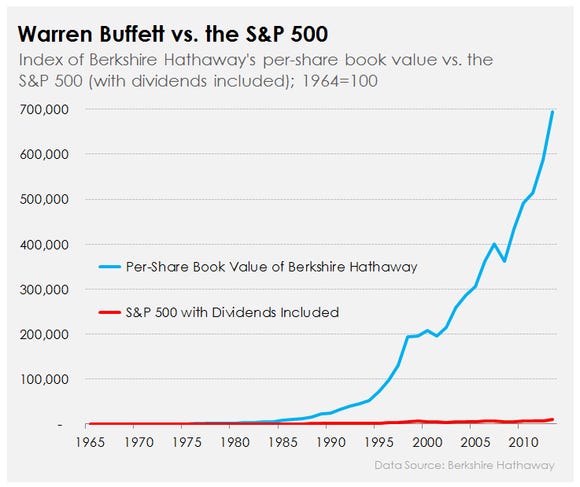
You likely won't find many track records longer or better than his. Most managers either blow up or retire before hitting longevity numbers like Buffett, and the track record of an entire firm, with multiple managers and directors and desks with different levels of ambition and skill and greed, that's a pretty murky thing.
I like rules-based algorithmic strategies (duh). They give us a lot of a jump start, because they're unfeeling, repeatable and unchanging in how they ultimately make investment decisions, and testable as far back as you can get data. Some of these rules-based strategies have backtests - which show historical hypothetical performance for a strategy that buys/sells in the past following the same rules it does today - which include slippage, entry/exit time, and net/gross fees, although no backtest is as good as real life data. These backtests, however, are the closest we can get to understanding a strategy’s performance before the strategy’s inception. Some of them showcase track records that rival and/or beat even Buffett’s - and they’re a longer time horizon too. Here’s one of these backtested strategies. (As you’re reading below, it’s always helpful to remain skeptical and on the lookout for why certain numbers are the way they are)
We most recently started working on beefing up our historical data for our 5 flagship funds: Algorithmic Flagship, Crypto Flagship, Alts Flagship, Quant Flagship, and Sentiment Flagship.
Let's talk about the Quantbase Algorithmic Flagship (more info here). It follows what's called a "risk on/off" rotation strategy, which means - if the market is doing well, let's be in the market, and when it's doing badly, let's be in bonds instead.

The hard part, obviously, is finding the signal that helps you determine in-market vs. out-market exposure. Here's what we use. The strategy, among other signals, mainly relies on moving averages, based on contemporary research that shows that they are a leading indicator for changes in market volatility. Backtested originally to 2016, the strategy has had an incredible annualized return of 24.24%, compared to 11.76% for the S&P. We might see a rising interest rate environment in the near future, and I wanted to see how well this strategy would hold up in a historically potent rising rates environment, the 1980s. But we decided to take it a step further -
We backtested our flagship algorithmic fund back to October 1928. Here's what we found:
The Process
Using multiple backtesting engines, including the open source Backtrader and our own proprietary engine (which takes into account our position entry/exit times and broker), we plugged in OHLC (open, high, low, close) prices for SPY, UPRO (3x leveraged S&P, our in-market vehicle), and BIL (short term bonds, our out-market vehicle), as well as for the S&P index (GSPC on Yahoo).
We go back to 6/25/2009 - of the ETFs we’re using, the youngest is UPRO, so that's as far back as a true end-to-end backtest can take us, one that most closely resembles our current strategy. For earlier data than UPRO, we use a combination of 3x GSPC, GSPC close, and cash to simulate an easy return to safety. A caveat here: UPRO != 3x GSPC! To simulate margin interest, our multiplier on GSPC returns was 2.8. We got similar (slightly more conservative) end values to contemporary research. We now have a trading strategy that harks back to pre-Great Depression - October 16, 1928.
The Insights
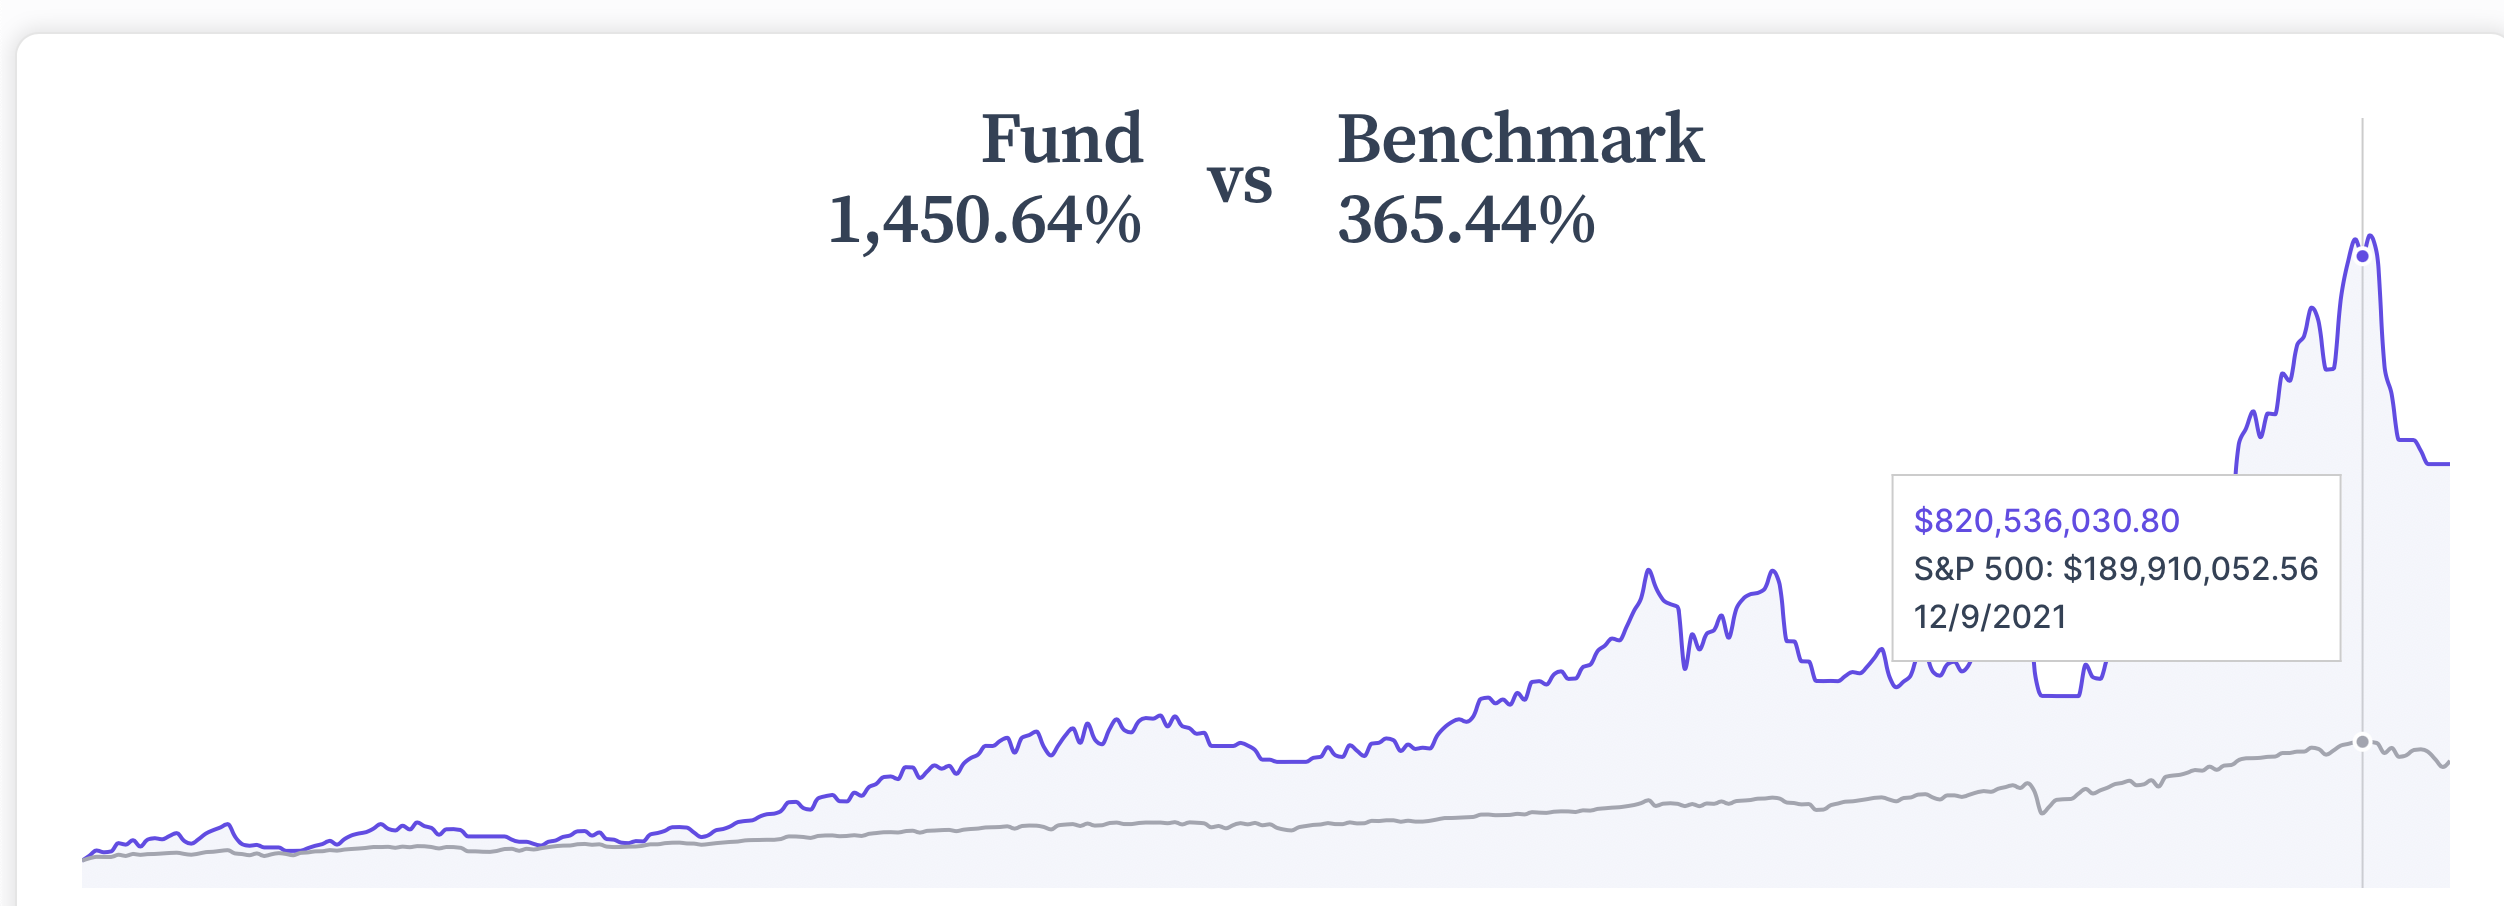
The Quantbase Algorithmic Flagship (henceforth QAF) - has a 29x overall return over simply buying and holding the S&P.
$1 invested in QAF in October 1928 equals $5,505.03 in June 2022
Inflation-adjusted, this is a 326x increase.
Compare this to $1 in the S&P index returning $189.41 and $1 in a buy-and-hold 3x leveraged position in the S&P returning $1,653.77 (non-inflation-adjusted)
The annualized return from October 1928 to June 2022 of the QAF is 9.89%, compared to 5.73% for the S&P index
The largest drop in the QAF's portfolio value occurred in the first week of March 1933 - a 71% drop
We don't get the pleasure of this crypto-like drop anymore, due to stock exchanges employing market-wide circuit-breakers
Largest drop since the inception of UPRO: 17.47% on 6/11/2020, after which the strategy switched to BIL (a 5.7% drop in SPY - the QAF employs a high-risk/high-return strategy, and it doesn't beat the index every single day)
Largest jump since UPRO inception in 2009: 12.97% on 5/10/2010 -- at the time, the fund was 100% in UPRO, and had been for 8 months. The streak ended 8 days after this jump, rebalancing into bonds for a few weeks.
The Data
The data here is quite interesting, and there is a lot of digging you could do. Keep me in line - here are the backtests we use for the QAF (CSV copy).
If you’re into this sort of stuff, you’d really like playing with this data. Shoot me an email if you find anything else interesting, or think the data is inaccurate. The general rules our strategies follow are free and open to read, although obviously we keep a bit of secret sauce to ensure that the triggers and signals we use don't lose their effectiveness.